• No products in the cart.
Checkout

BlinkTech

Latest News

Integrated Software Development Kit for Zoom Thermal Camera

By Comments Off on Integrated Software Development Kit for Zoom Thermal Camera
The ImageIR® 6300Z zoom infrared camera is now even more flexible than before.

The ImageIR® 6300 Z zoom infrared camera is smaller, lighter, does not require any time-consuming lens changes – and now also boasts an integrated Software Development Kit (SDK). With technical features such as the 7.5x zoom lens with motor focus (built in as standard) and its compact size, the radiometrically calibrated zoom camera was already a force to be reckoned with.

Now it is taking things to the next level: with the ImageIR® 6300 Z, a new generation of electronics is entering the field of thermography, allowing an operating system to be embedded directly in the camera (embedded system). In addition to the well-known benefits of a Software Development Kit, the integrated SDK opens up numerous other possibilities for users:

  • Independent operation of the camera without PC
  • Automated control of camera functions with the aid of the integrated SDK
  • Implementation of evaluation algorithms and camera control based on these algorithms directly in the camera

These SDK functions make it possible to let the thermography camera run autonomously. If programmed appropriately, the camera no longer requires a permanent, stable network connection to a PC. This makes it ideal for use in hard-to-reach places and facilitates integration into and adaptation to existing systems.

The new integrated Software Development Kit was developed and optimised by InfraTec in collaboration with customers from industrial and research environments.

View Product

Featured Research – Photron High Speed Cameras and DIC

By Comments Off on Featured Research – Photron High Speed Cameras and DIC

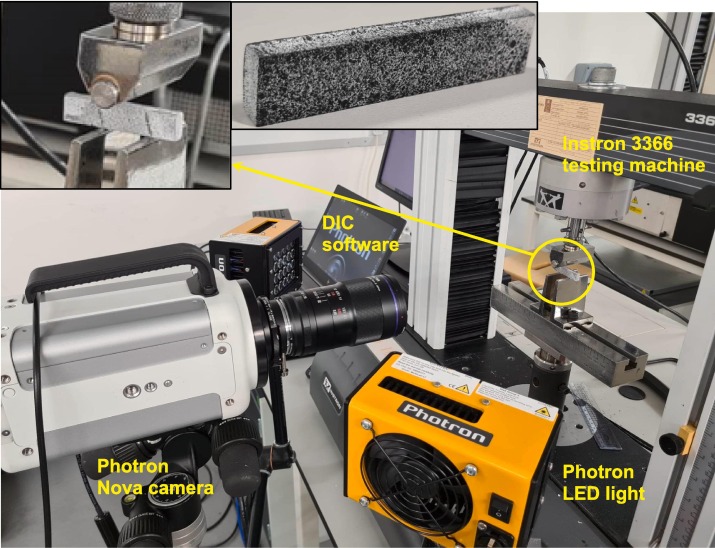
Fracture behaviour of reaction-bonded silicon carbide-boron carbide using digital image correlation

The study investigates the fracture behavior of Reaction-Bonded Silicon Carbide-Boron Carbide (RBSBC) ceramics using the Digital Image Correlation (DIC) method. A Photron NOVA S Series camera, capturing at 137,500 frames per second, was crucial in documenting the rapid crack propagation and brittle behavior characteristic of these ceramics. Proper lighting setup was essential to ensure high-quality image capture and accurate data.

RBSBC exhibited transgranular failure, with randomly dispersed coarse B4C grains deflecting the crack path and increasing the overall crack length. The material’s resistance to crack propagation was evaluated using Crack Tip Opening Displacement (CTOD), stress intensity at the crack tip, and the J-integral.

Two methodologies were used: one based on experimental DIC-derived displacement metrics and another on a quasistatic assessment of fracture load and crack geometry. The experimental method provided more accurate resistance values, while the quasistatic approach tended to underestimate resistance.


Full Article


VIC 3D 10 Release!

By Comments Off on VIC 3D 10 Release!

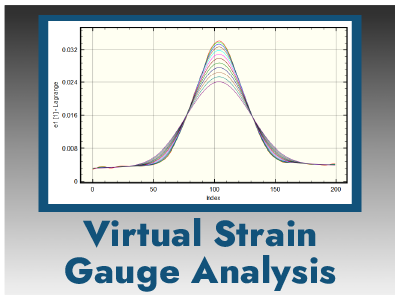
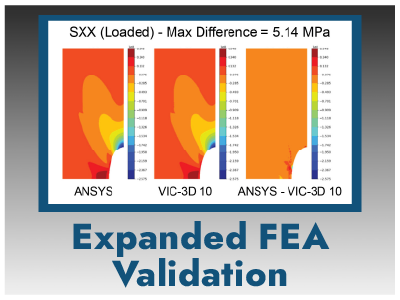
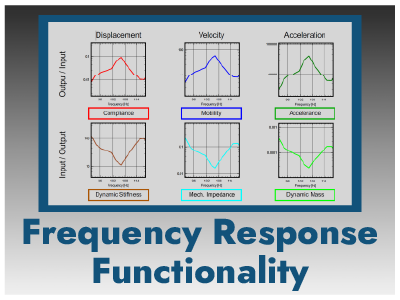
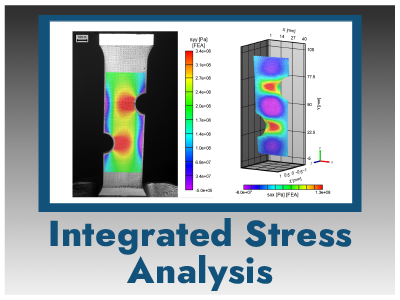
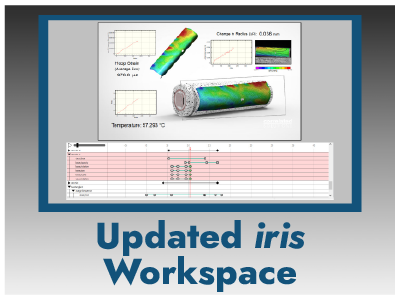
Correlated Solutions is proud to announce the release of VIC-3D 10, an unparalleled DIC workspace with features designed specifically to facilitate 3D data analysis and visualization. Building on iris, the data visualization engine introduced in Version 9, the all-new VIC-3D 10 delivers a range of new capabilities that broaden DIC’s scope for FFT projects, FEA validation, and integrated stress analysis. In addition, the iris workspace has been significantly updated to provide even more flexibility and functionality to display your DIC analysis clearly and professionally.

New VSG analysis tool automates & streamlines the determination of optimal VSG size in accordance with the DIC Good Practices Guide.


In conjunction with FE simulations in Abaqus & Ansys, users can now more effectively and efficiently validate FEA results.

New frequency response function measurements integrate force input data with a powerful FFT module for complete response analysis.

Integrated stress analyzer converts strain history to stress with models defined through a dialog or through JSON files.

New FFT vibration visualization in iris allows for in-plane & out-of-plane ODS to be displayed in stunning, high-resolution graphics.

Import extractions, image & data sequences from other projects for direct comparison and improved visualization.


Contact Us To Upgrade

Large-Scale, Multi-System DIC

By Comments Off on Large-Scale, Multi-System DIC

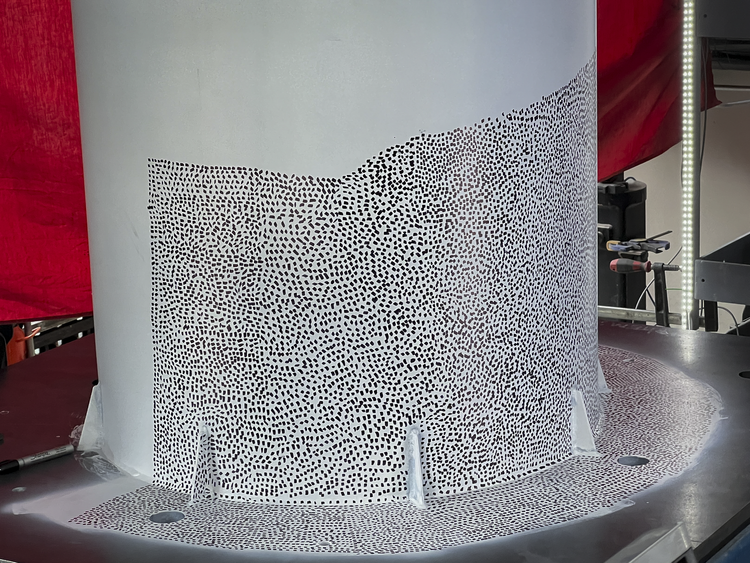
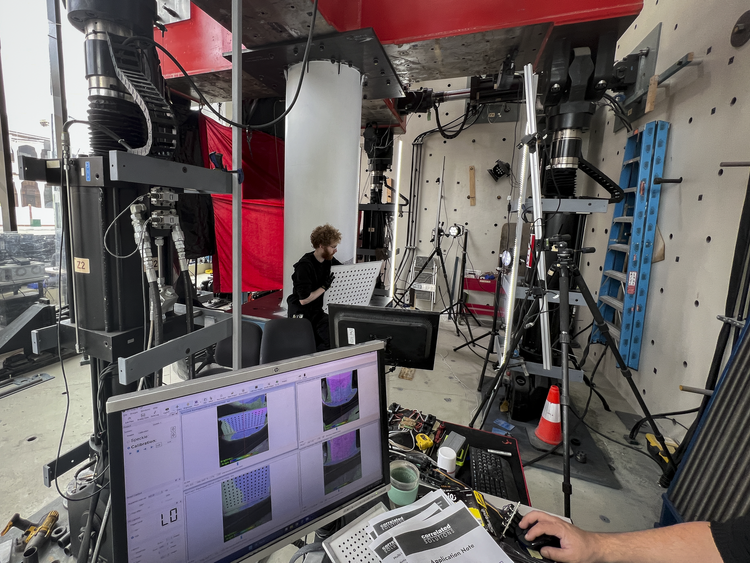
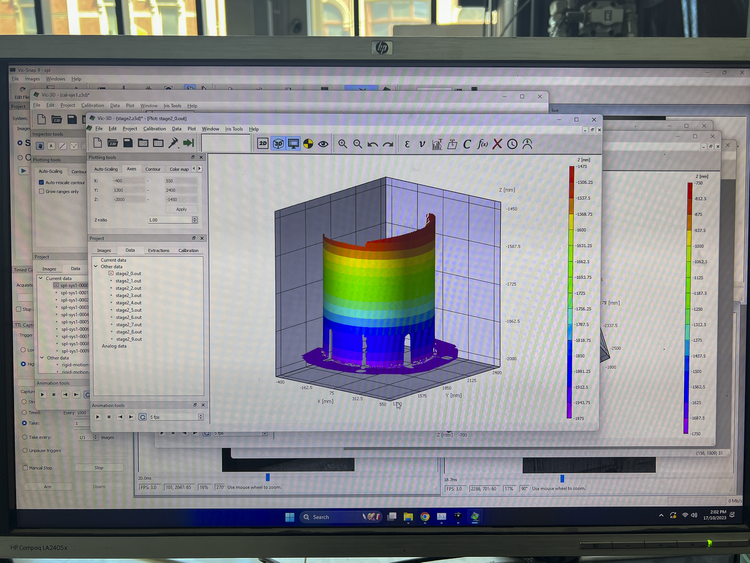
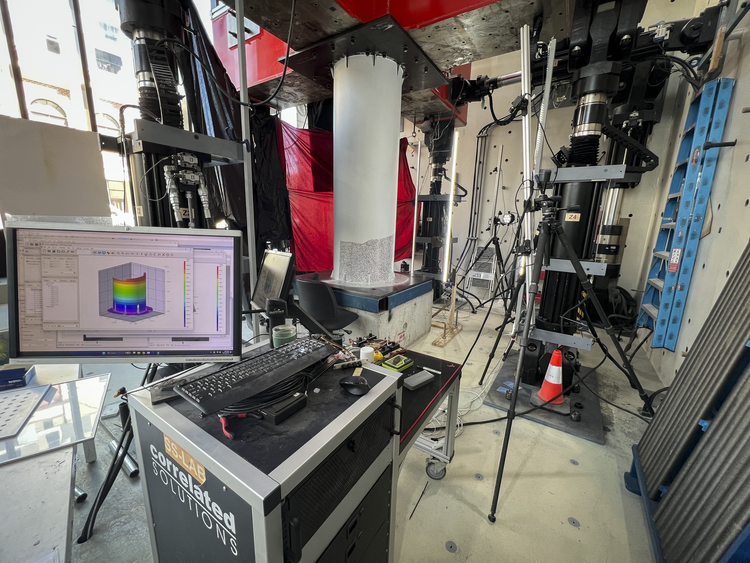
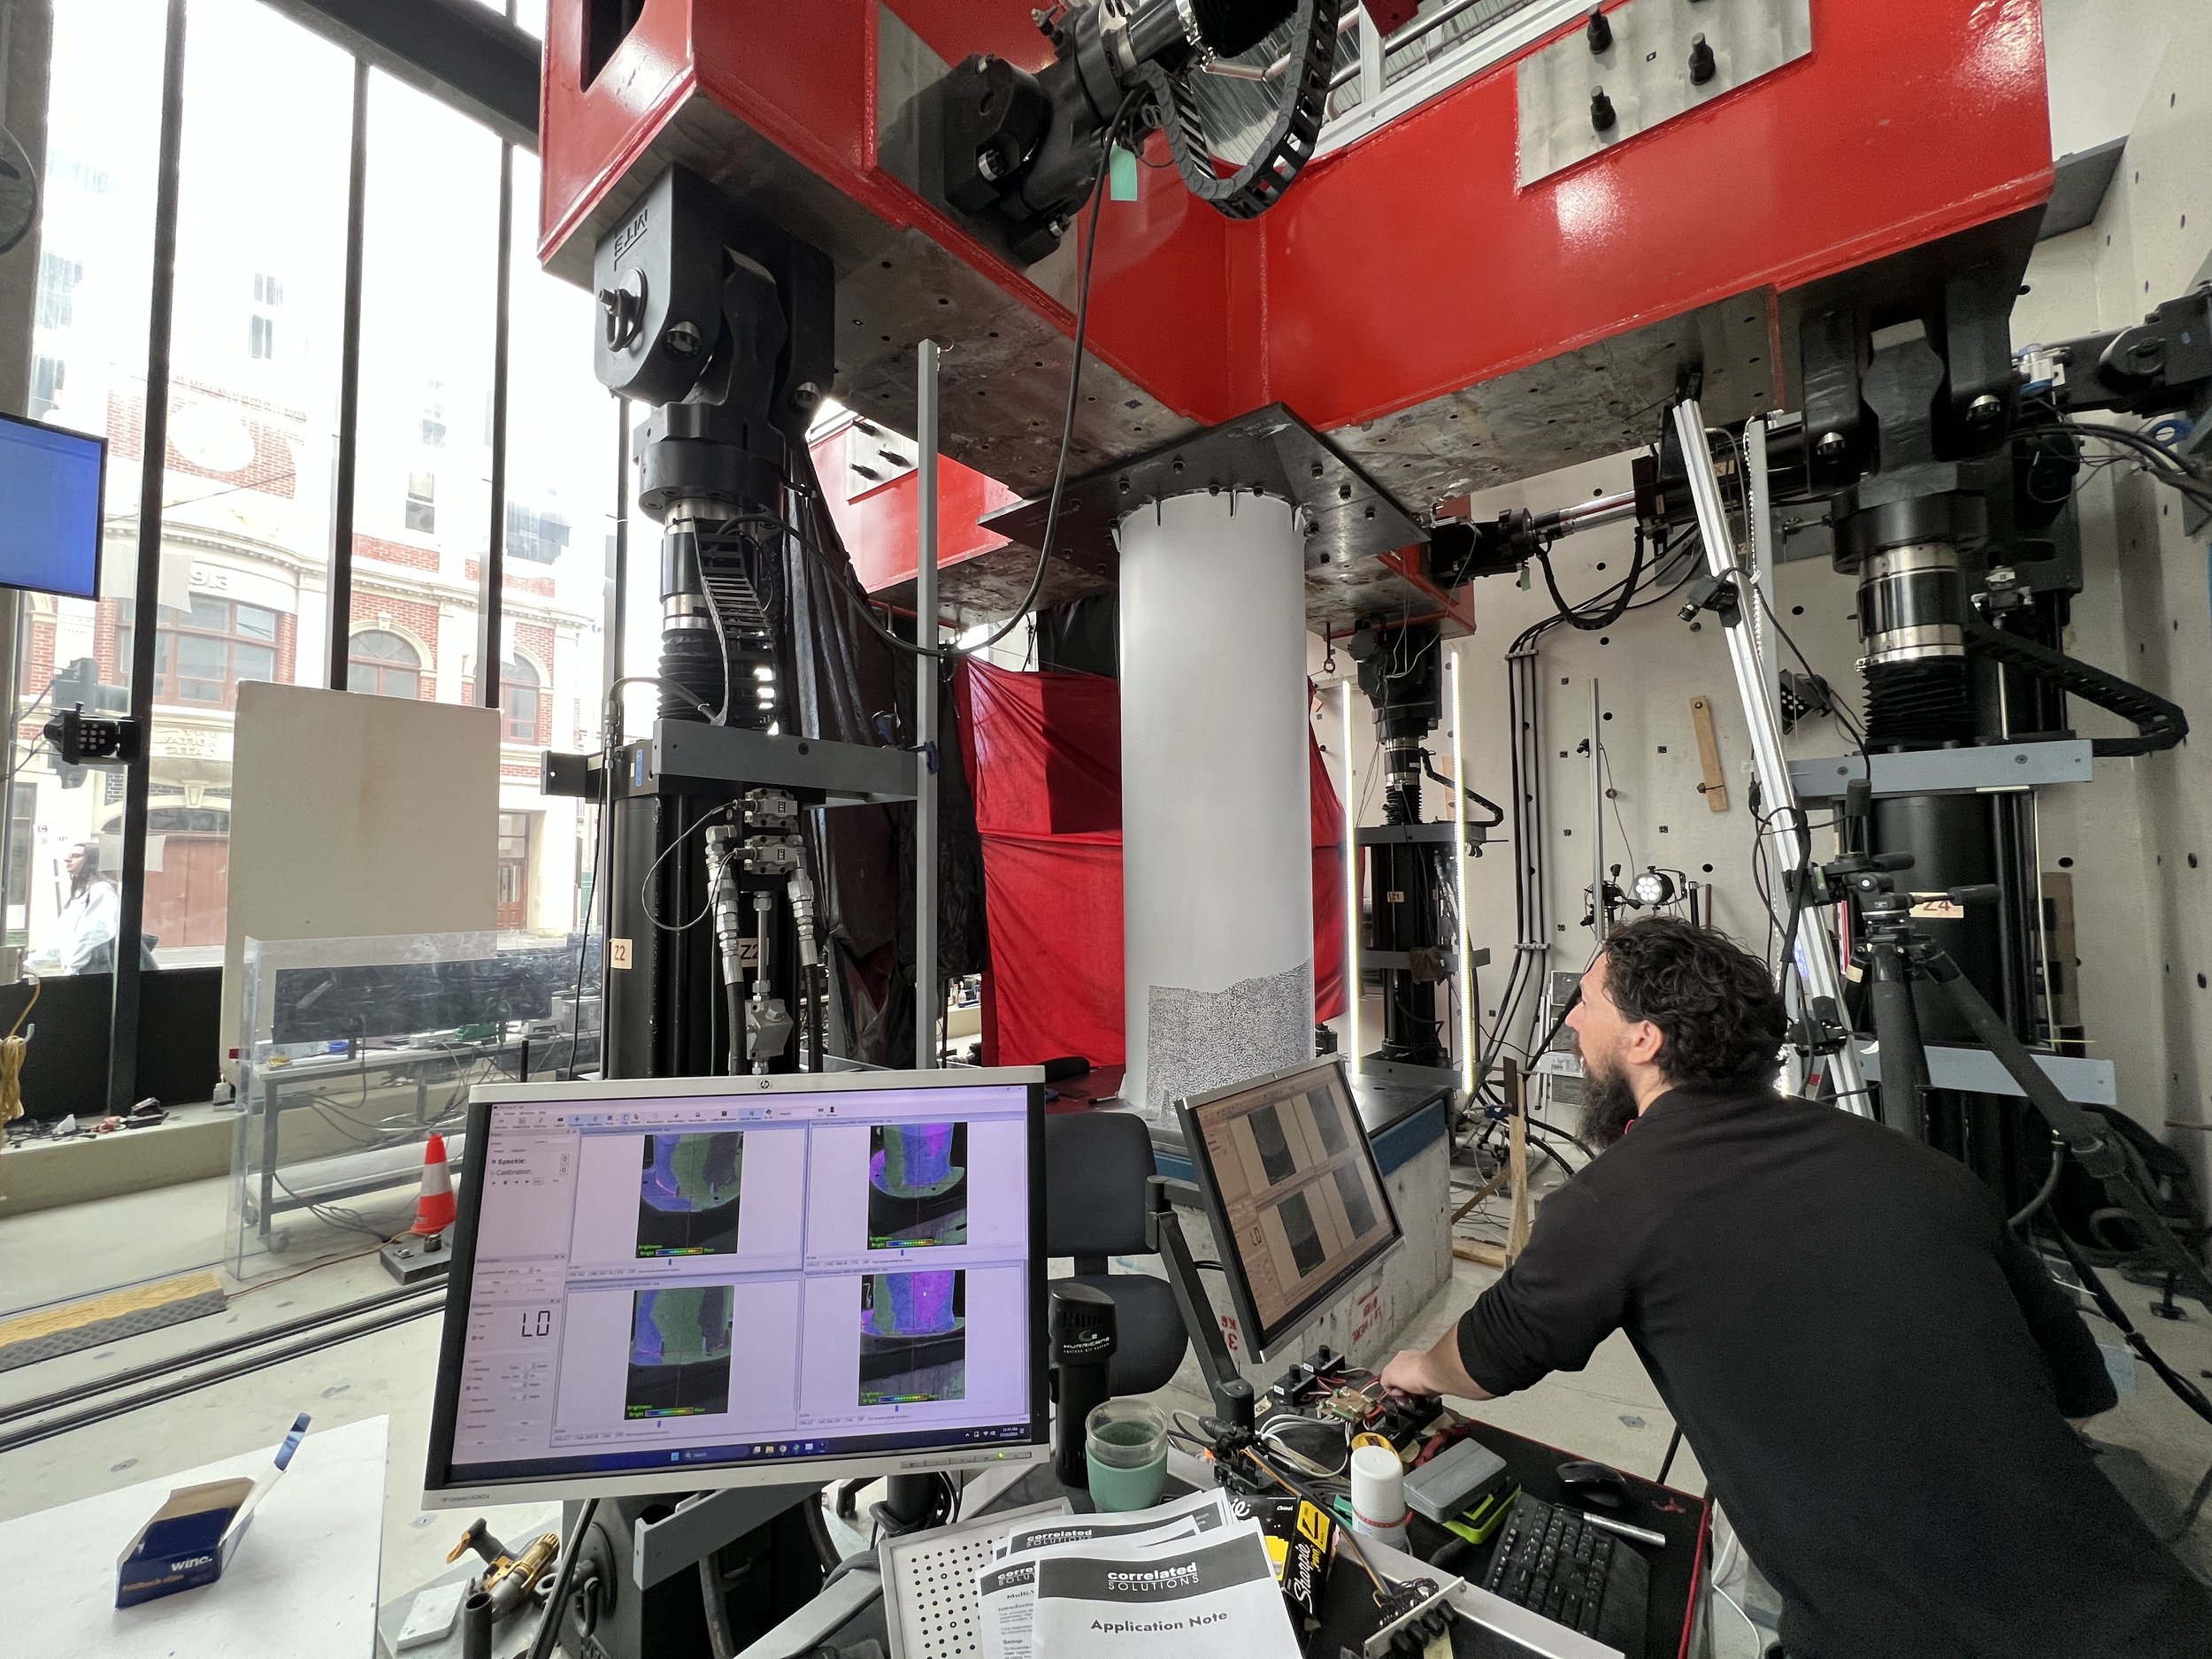
Correlated Solutions and Blink Technology Australia recently visited Kevin Nievaart and his team at Swinburne University of Technology’s Smart Structures Laboratory to assist in deploying the multi-system digital image correlation registration which combines data from two or more VIC-3D DIC systems. This procedure provides a common coordinate system without any overlapping requirements and can dramatically reduce the effort and time needed to interpret and analyze deformation data.

When teams are working with tools like the impressive Multi-Axis Substructure Testing (MAST) System, streamlining workflows is paramount, and the VIC-3D Multi-System was the obvious answer for boosting the performance and research efficiency of the Smart Structures Lab. Special thanks to Kevin and his team for all the hard work. We can’t wait to see more results!


Digital Image Correlation Training Series – Basic Calibration

By Comments Off on Digital Image Correlation Training Series – Basic Calibration

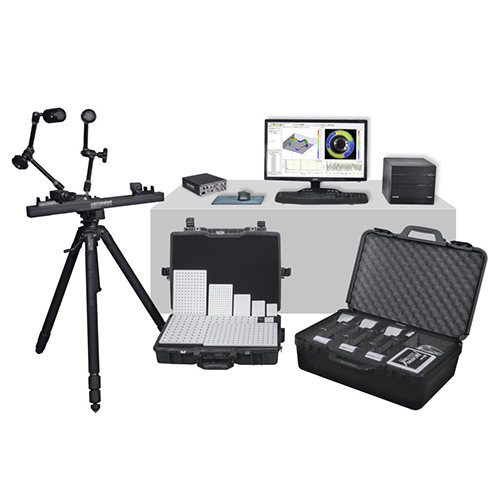
Whether you’re new to digital image correlation or just need a refresher for upcoming research, the Correlated Solutions DIC tutorial series featuring the powerful VIC-3D is here to help. If you want any more information or want to book an in-person training session in Australia or New Zealand for the Vic 3D Digital Image Correlation system contact us to find out more.


Adding new value to rheometers

By Comments Off on Adding new value to rheometers

Adding new value to rheometers

with next generation of analysis through “polarization imaging”

This equipment can clarify material properties based on the molecular structure of polymers.

Recently, there is an increasing demand for detailed analysis of the change process of material structure for advanced control of viscoelasticity.

In this page, we will introduce a “structural analysis method using polarization imaging” that combines a rheometer and a high-speed 2D polarization camera to meet these needs.

Polarization high-speed camera for viscoelasticity evaluation

Polarization high-speed camera and rheometer

*The rheometer is a product of Anton Paar
http://go.pardot.com/e/274612/en-products-crysta-pi-5wp-/hf2kn/589101049?h=kjns-AGZYWJ8UlPHU5oOHlQZDrDiY4wlHSject9SrK4

Feature
The high-speed polarization camera can quantify the polarization state in a single shot, and can track instantaneous changes in viscoelasticity due to its high-speed imaging performance.

Capturing instantaneous orientation changes of polymer fluids
http://go.pardot.com/e/274612/en-case-case-853/hf2kr/589101049?h=kjns-AGZYWJ8UlPHU5oOHlQZDrDiY4wlHSject9SrK4
Video: http://go.pardot.com/e/274612/E-8lGrOyjYQ/hf2kv/589101049?h=kjns-AGZYWJ8UlPHU5oOHlQZDrDiY4wlHSject9SrK4

Measurement example – Dynamic structural change of cellulose nanofiber (CNF)
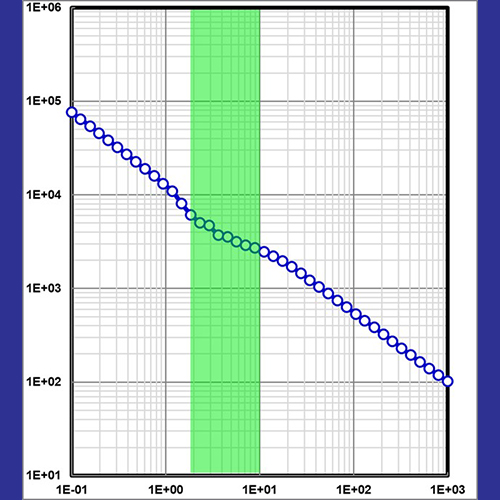
CNF has a three-dimensional network structure, but as shown in the viscosity curve below, it exhibits shear-thinning behavior in which viscosity decreases with shear rate. However, there is a viscosity plateau (green area) around ~10 sec-1.

Viscosity curve of CNF
What kind of structural changes occurred in this plateau?

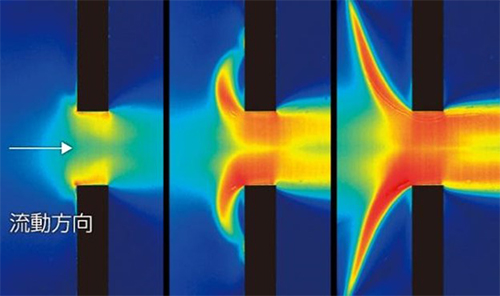
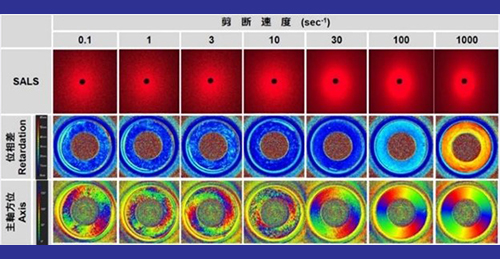
Looking at the scattering image of SALS (Small Angle Light Scattering) in the figure below, the shape changes from a circle to an ellipse as the shear rate increases. This corresponds to aggregates of fibers oriented in the direction of flow.

According to the orientation of the principal axis of the polarization image, the orientation of the fibers was spatially random before 10 sec-1, but after 10 sec-1 they suddenly oriented in the direction of flow, making them uniform in the radial direction within the channel. This confirms that it changed to a smooth state continuously.

Usually, if the viscosity curve is different from what we expected, we often suspect foreign matter contamination or that the equipment itself is somehow defective. In this study, we were able to gain a deeper understanding of the viscoelastic characteristics of CNFs by capturing instantaneous changes in the orientation of polymer fluids in combination with polarization imaging.

Upcoming Events

By Comments Off on Upcoming Events

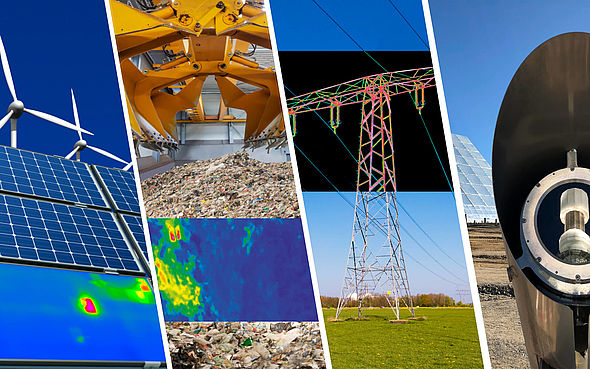
Ther­mo­graphy for Improved Energy – Higher Effi­ciency and Security in Renew­able Ener­gies

The transformation to using renewable energy sources is a basic prerequisite for achieving the current climate protection goals. It is a necessity, considering the finite nature of fossil fuels and it’s essential for an increasing independence from providers of conventional fossil energy sources. In this context, energy production and intermediate energy storage need to go hand in hand.
More Information


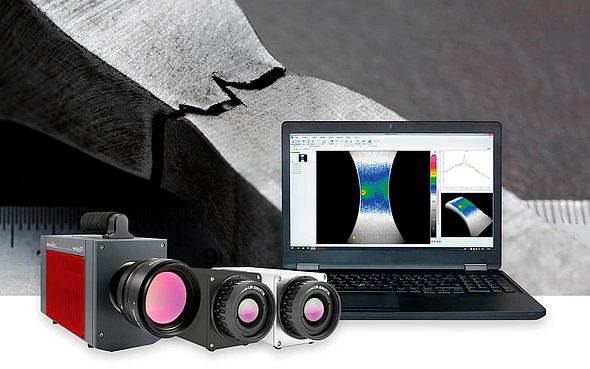
Effi­cient Material Testing – Non-destructive and Contact­less

Conventional but especially the growing additive manufacturing processes – both in prototyping and industrial production – require increasing quality control of the final products. Additional to the established destructive testing of the material, non-destructive analysis of the final components is indispensable for material characterisation.

More Information

Regular Preventative High Speed Camera Maintenance

By Comments Off on Regular Preventative High Speed Camera Maintenance

Like any tool, regular cleaning and maintenance will extend the life of your investment as well as helping to reduce the unplanned downtime (which always seems to happen at the worst time!). Blink Technology alongside Photron USA have put together a few preventative maintenance packages which are available to be undertaken at any time.

Maintenance services:

Option 1: Standard cleaning that includes taking apart the camera and cleaning contacts, reseating circuit boards, cleaning the sensor, and replacing any damaged or worn gap pads.

Option 2: Standard cleaning option as well as a firmware upgrade to the latest revision and image quality adjustment.

Option 3: Extensive cleaning that includes all of option 2 as well as cleaning the boards in an ultrasonic cleaner.


Contact us for pricing or more information.

VIC-3D DIC 9.4 Release

By Comments Off on VIC-3D DIC 9.4 Release

The development of the VIC-3D system continues at a blistering pace. Taking our lead from customer requests and advancing digital technology, the third update in less than a year brings significantly more agile and powerful features to our flagship DIC solution. As systems continue to be shipped around the world and deployed in a wide variety of applications, we are proud to announce the release of VIC-3D Version 9.4 which contains enhancements to marker tracking and point/marker visualization, as well as FFT improvements. The new features include:

  • All-new 3D marker tracking visualization in iris 
  • Customizable marker/extraction labels with escape codes for inserting data
  • PDF export now supports automatic generation of pages for multiple timestep
  • Velocity computation in FFT
  • New dialog for batch processing with automatic report generation
  • Export area FFT data to Universal File Format (UFF)
  • Velocity and acceleration calculation for markers
  • Visualization of locations and trajectories of extraction points in iris

Thermography in Plant Research for Agriculture

By Comments Off on Thermography in Plant Research for Agriculture

Environmental conditions today often tend towards extremes. Many areas are very humid and wet, while others are predominantly dry. Particularly in the second case, cultivating raw materials such as grain, beet or maize is a challenge. A challenge that KWS SAAT SE & Co. KGaA is facing. As part of its plant research, the company uses the VarioCAM® HD head 900 infrared camera from InfraTec to analyse the behaviour of plants during drought stress and pest infestation.

Plants of the Future

Research into the behaviour of plants under drought stress plays a crucial role for future agriculture. This is because the research results provide insights into how adaptable and robust a plant variety is and how it reacts to different temperatures. This, in turn, enables decisions to be made about which varieties will be bred further. In the past, specific statements about plant behaviour under drought stress were limited. But with the help of thermography, scientists now have access to valid measurements that allow them to take new selection options into consideration and develop more robust and resistant plant varieties.

KWS SAAT SE & Co. KGaA’s work includes multiplying and distributing sugarbeet and corn seed. The company finances basic research and the breeding of the KWS Group’s range of varieties and provides its subsidiaries with new sorts for multiplication and distribution every year.

Ther­mo­graphy for Better Plant Growth and Against Pest Infest­a­tion

But how does an infrared camera help to detect drought stress or pest infestation of a plant? The answer is quite simple: by measuring the leaf temperature. Complementary to visual cameras, the infrared camera provides exact surface temperatures and their distribution on the leaf. This enables conclusions to be drawn about leaf health and robustness as well as plant growth. This is done without contact and, due to the high geometric resolution, allows the recording and evaluation of large areas. What is measured is the heating of the plant during drought stress, which is not visible to humans, in comparison to the previously determined plant temperature under favourable conditions. Light reflected and absorbed by the plants in different wavelength ranges is recorded for this purpose.

For research on pest infestation, such as in the Dataplant project, a special laser is used that emits a beam of infrared light and illuminates the leaf green. At a certain wavelength in the infrared range, infested or diseased leaf areas are heated differently than healthy ones. The VarioCAM® HD head infrared camera from InfraTec is used for the measurement. Its compactness and handy size allow easy integration into mobile measurement set-ups. There the camera measures how the individual leaf areas heat up and transfers the temperature values directly to the control PC. The data can be stored and evaluated on this PC with an associated software.

Download Case Study