Description
While the cross-correlation core of the very well known PIVview software is used to process the images (PIVview was top rated at the PIVNet challenge in 2005 and 2014), ILA’s Piv-Scheduler offers an advanced interface for an easy-to-use batch processing: PIVtecILA was born.
Let us guide you through a typical post-processing:
After setting up your hardware, Image acquisition is done using our ILACamWare software (included with our Cameras) and images are saved directly to your hard disk in a selectable file format. From here on, it’s your choice…

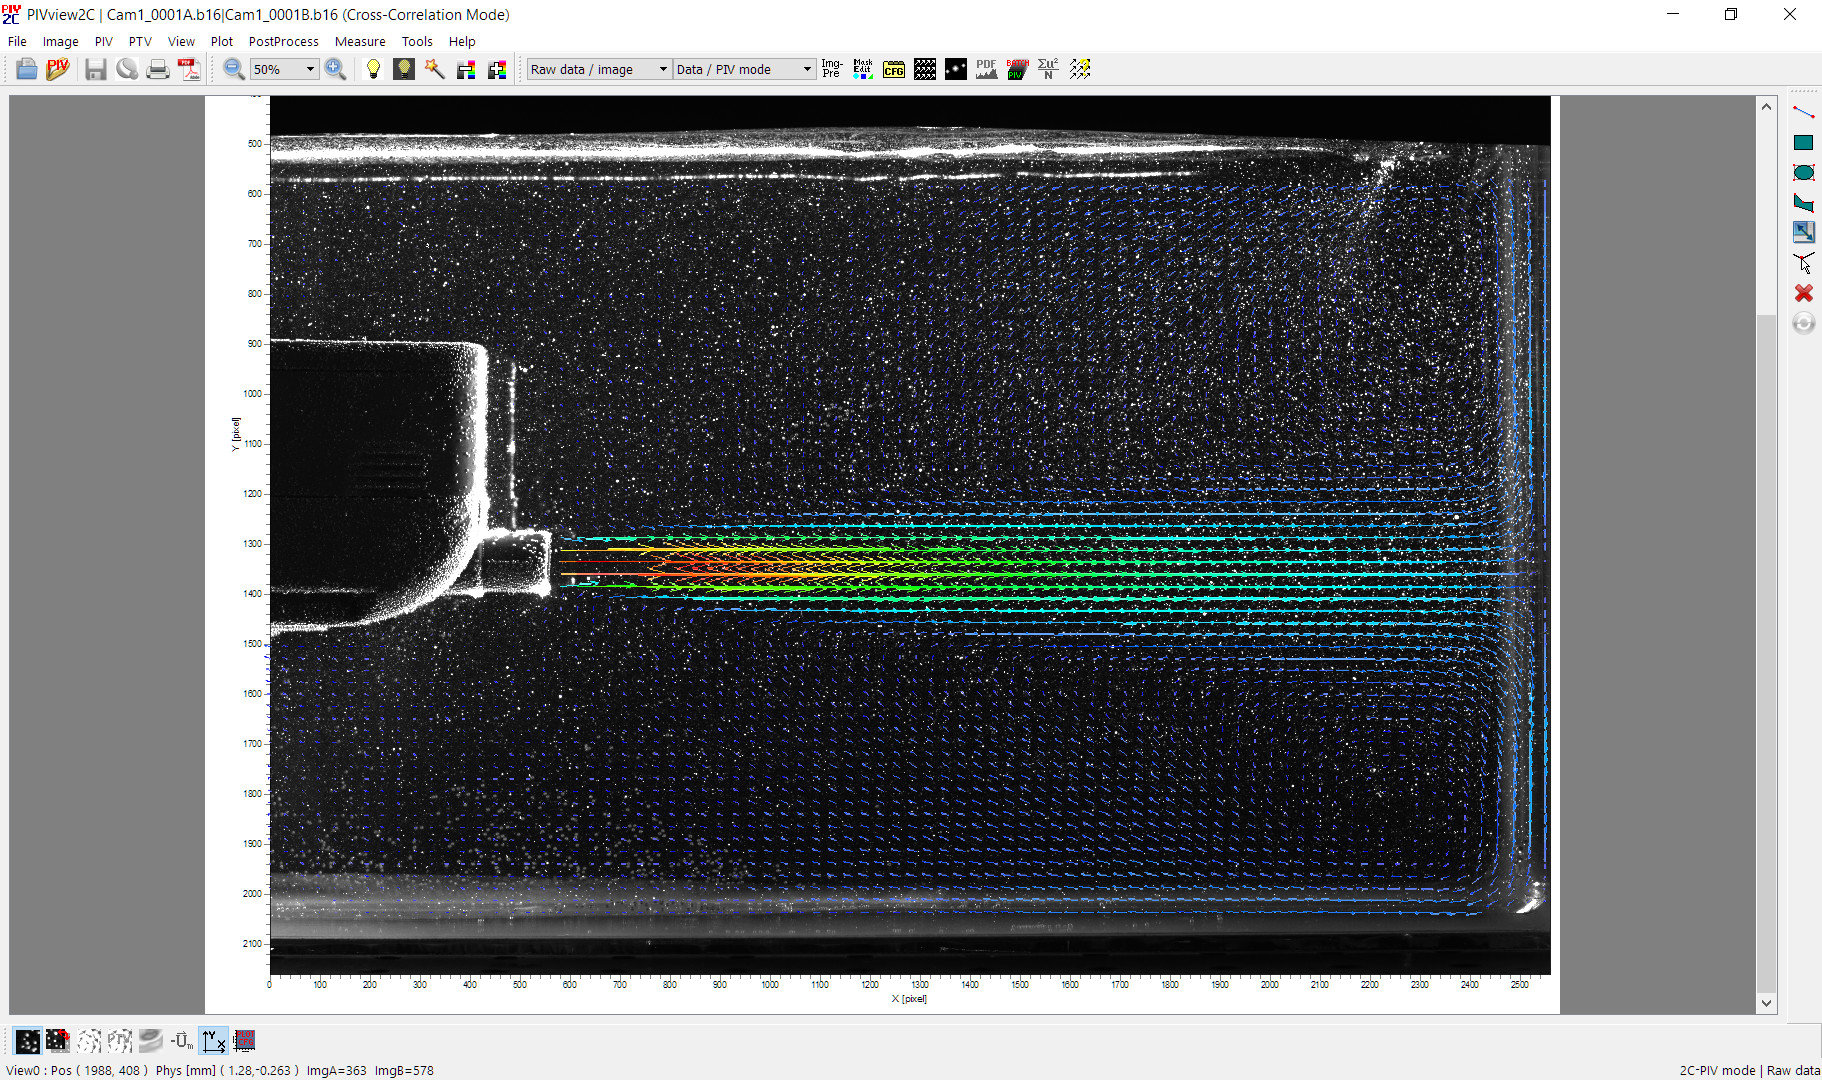
Get the most out of your Cross Correlation with PIVview
We would (of course…) recommend using our adapted software package: Start with PIVview and use its powerful features to get the most of your gathered data. While the default values give you a solid first glimpse on what you can expect from your data, you can also finetune your results by adjusting every single option up to the point that it fits your specific needs.
You don’t like secret magic and black boxes? We don’t like them at all! That’s why so far, you have only created a config file for PIVview… and that one is plain ASCII. While the standard user won’t use this feature very often, the power user has every single option right at hand: Integrate it in your own script, manipulate variables, automate your post-processing… Do what you want, if you know what you’re doing.
Time to go multicore: PIV-Scheduler
In most of the cases, parameters for data evaluation are quite similar for each individual plane or parameter in your experiment and only some variables have to be adjusted individually. This is where our PIV- Scheduler comes in handy: Typical tasks, such as masking, background generation, evaluation, file movement and macro launching can be arranged as individual jobs via an intuitive interface. Once your personal road-map is set, it’s time to fire up your cores… and this is where another strong feature kicks in: Depending on feasibility, the PIV-Scheduler parallelizes the task at hand and distributes the jobs to the available cores. While for standard university usage, a single machine with 8 cores offers a good cost-benefit ratio, we also offer Tailor-made integrated solutions with >100 cores for our power and industrial users.
Your results, your possibilities
After processing the data, each individual velocity data sets is available in a structured grid ASCII (*.dat) TecPlot readable format and in NetCDF (*.nc). Additional user selectable parameters like vorticity, shear strain and many more can be generated during the evaluation procedure as well. Further processing can then either be done by common presentation software (e.g. TecPlot, Ensight, ParaView, …), or even furthermore by an additional post-processing (Matlab, Python, …).


