• No products in the cart.
Checkout

BlinkTech

Author: marketing@blinktech.com.au

Plasma Fusion Infrared Camera

By Comments Off on Plasma Fusion Infrared Camera

Thermographic Analysis of a Fusion Plant

What will the energy supply of the future look like? The Max Planck Institute for Plasma Physics (IPP) in Greifswald is dealing with this question.

In accordance with the weightily initial question, the researchers can draw on an impressive research instrument. “Wendelstein 7-X is the world’s largest stellarator-type nuclear fusion facility,” says Dr. Marcin W. Jakubowski from Stellarator Edge and Divertor Physics Department at IPP. “It is intended to show whether this construction type is suitable as a permanently operated power plant.” The aim is to achieve plasma discharges lasting up to 30 minutes with this plant, in other words, half an hour of continuous operation. This would be an important preliminary work on the way to a form of energy production that does not require fossil fuels such as oil, coal and gas, does not produce CO2 emissions and does not further promote global warming. During the second experimental campaign, which ended in October 2018, discharges lasting up to 100 seconds were achieved. This is considered a world record for a fusion facility of this type.

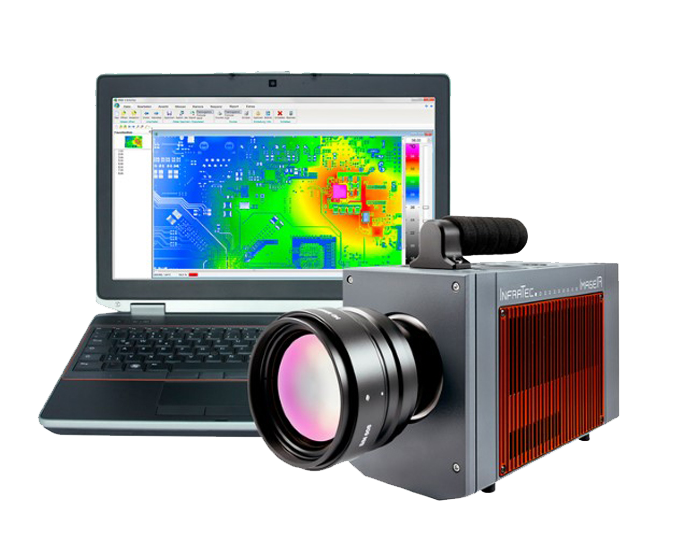
Use of the High-end ImageIR® 9300 Camera Secures Operation of the Fusion System

The scientists measure temperatures of up to 1,000 °C on the surface of the graphite tiles. In exceptional cases and locally very limited, up to 2,000 °C are registered. “Temperatures of more than 1,200 degrees Celsius are critical,” explains Dr. Marcin W. Jakubowski. “If this happens, the divertor can be damaged and tile elements can come loose.” If this were to happen, the system would have to be stopped and the divertor repaired. The consequence would be a forced break of at least six months.

Download Case Study

Photron Polarisation Cameras

By Comments Off on Photron Polarisation Cameras

Introducing the world’s fastest 2D polarisation camera, at over 1 million frames per second!

Key Uses include:

  • Analysis and visualisation of internal stress distribution during metal processing
  • Evaluation of stress propagation around cracks due to impact fracture
  • Dynamic observation of crystal axis/orientation state on liquid crystal/crystal material
  • Visualisation of fluid stress distribution generated by viscoelastic body or soft matter

Polarisation can measure and visualise various physical quantities and properties

Polarised light cannot be recognised visually but is light where “light waves oscillate in a single plane”. Since the polarisation state of light varies depending on the internal structure of the transmission object and the surface shape of the reflected object, it can be applies to measure various physical qualities and visualise phenomena by obtaining the polarisation state before entering and after exiting the object. By combining this “polarisation information” with the conventional high-speed camera images, it is possible to study the load applied to a cutting tool at the same time as analysing the stresses inherent in the transparent material in the images, and understand the stress propagation and relaxation processes in impact test and flow phenomenon.This enables us to visualise events that cannot be seen by conventional means, qualitatively measuring the uniformity of the spatial performance of the alignment film in a non-contact manner.


*All information provided by Photron USA

Digital Image Correlation in Real Time

By Comments Off on Digital Image Correlation in Real Time

Real time measurement of strain and deformation can be a valuable asset and is available through Vic-Gauge real time processing. The below is a real case study of how Vic-Gauge was used, as part of a solution generated by Correlated Solutions to measure real time strain.

Key Objectives of DIC Project

  • –Measure real-time strains and deformations of flexible sheets
  • –Real-time analog output for strain and displacement measurement to control test

Challenges

  • For single camera, several key requirements
    • Minimise the out-of-plane movement
    • Maintain nominal planarity of specimen surface
    • Keep sensor plane nominally parallel to specimen surface

Advantages of DIC Measurement System

  • Full-field deformations throughout experiment
  • Both quasi-static and dynamic loading measurable


Careful positioning and orientation of the DIC camera is crucial for most accurate measurements

  • Correct orientation is readily achieved with carpenter’s square or laser pointer and a small mirror attached to specimen holder.

Minimize the error from any out-of-plane specimen movement by increasing distance from camera to the specimen

  • Increased lighting intensity necessary for this situation

Key Points

  • Test can be controlled using output analog signal from Vic-Gauge
  • Large or small deformations are measurable

Photron 6D Marker Software

By Comments Off on Photron 6D Marker Software

Traditional 3D motion analysis requires a complicated setup procedure, where at least two or more high speed cameras have to be precisely positioned and calibrated using an intricate procedure involving a dedicated jig.  Once this has been completed,  dedicated software has to track and measure any points of interest as they move through space in all three axis (X, Y and Z). Further calibration and equipment might be required if you need to also extrapolate the objects attitude with regard to its roll, pitch or yaw.

Photron’s 6D-Marker greatly simplifies this process. It utilizes a high precision lenticular marker that enables any single camera, of any resolution or framing rate, to quickly and cleanly measure the object of interest’s six coordinate sets in free space. These six coordinate sets are referred to as 6D, or 6DoF (short form for six degrees of freedom).

Furthermore, if the original camera and lens combination are available, it is a straightforward matter to recreate a model to analyze previously recorded videos, regardless of their resolution or recording speed. All that is required, asides from the 6D-Markers being affixed to the test subject of course, is that a calibration file is produced with a simple procedure requiring nothing more than a 2D checkerboard calibration board be moved around within the desired field of view.

There are a number of high speed video appliccations which could use the 6D software including:

  •  Biomechanics
  •  Vehicle impact safety testing
  •  Robotic pick and place
  •  Aerospace
Download Data Sheet


Crash Testing with AOS High Speed Cameras

By Comments Off on Crash Testing with AOS High Speed Cameras

The AOS high speed camera range has for years been used as part of crash testing around the world. Their newest range of camera offers incredible resolution at high speed meaning that they are able to capture even more detail at a higher frame rate.

The below sequence of videos showcases the range of cameras used in a crash test of a truck, filmed at 80km/h.

Truck hitting congested cars 80km/h filmed with AOS L-Pri @ 2500/fps. Footage provided by AOS Technologies

Truck hitting congested cars 80km/h filmed with AOS M-Pri @ 1200/fps. Footage provided by AOS Technologies

Wide angle of truck hitting congested cars 80km/h filmed with AOS L-Vit @ 1000/fps in full HD. Footage provided by AOS Technologies


Tire Inspection with Thermography

By Comments Off on Tire Inspection with Thermography

Mechanically stressed car components like tires are a continuous issue for quality inspection and related R&D improvements. At Bridgestone Corporation in Hofu (Yamaguchi prefecture in South- Western Japan) new test procedures for off-the-road tires for construction and mining vehicles (OR tires) had to be developed to meet the literally growing scale of performance concerning the carrying capacity.

Huge dump trucks like a Komatsu 960E-1K can carry more than 300 tons of mine rock. When this monster moves on stony soil for many hours a day the workload on those tires is enormous. The long-term tests realised by Bridgestone run in different factories and include parallel inside and outside thermal inspections. The inside inspections are accomplished after several holes have been drilled into the tires carcass, while the outside measurements concentrate on external peripheral structures.

To allow a precise measurement during different rotation speed settings a very exact triggering interface for the infrared camera is required – no problem for an ImageIR® 8325. Utilising its nanosecond precision trigger interface the high precision camera collect data with a temperature resolution of 20 mK, very short integration times in the microsecond range and extreme high frame rates.

View Original Article

Article Produced by Infratec in conjunction with Bridgstone Corporation

Active Thermography and IR cameras

By Comments Off on Active Thermography and IR cameras

IR Camera Range

Active thermography is the induction of a heat flow by energetically exciting a test object. The heat and the flow of energy is then influenced by defects or material layers which makes it a great application for materiel testing. These inhomogeneities can be sen on the surface by high-precision infrared cameras such as our ImageIR and Variocam range.


Our range of cooled IR cameras are perfect for any active thermography application within the engineering, health or automotive industries. The cooled cameras allow for a more accurate temperature measurement at a higher resolution. The range of thermal cameras has geometric resolutions of up to (1,280 x 1,024) IR pixels and thermal resolutions far below 0.015 K. As well as this, there is optional high temperature calibrations allowing the measurement of materials such as metal and others with high heat conductivity


IR Software

The thermography software IRBIS® 3 active analyses the thermo-graphic sequences, which have been generated during the test, and edits them to create a false colour image, in which defects can be marked for further evaluation or documentation. For this purpose, several different analysis procedures are available. The choice of the correct algorithm depends on the material characteristics, geometry and type of defects to be detected.

While the quotient method investigates the heat flow of the test object by reference to the increase and decrease of the surface temperature, the pulse-phase thermography (PPT) relies on the analysis of the temperature profile of different frequencies. For each frequency, two event images are generated, one amplitude- and one phase image. The lock-in thermography (LIT) analyses the sequence of periodic excitation of the test object.

Application of Active Thermography]

Active thermography has a number of applications, however is mainly used in manufacturing and material testing. Some specific applications include:

  • Detection of layer structures, delaminations and inserts in plastics
  • Detection in CFRPs of the automotive and aerospace industry
  • Investigation of interior structures or impacts on honeycomb lightweight constructions
  • Recognition of deeper material deficiencies, such as blowholes in plastic parts or ruptured laser welding seams